
Casio Only 1 left in stock - order soon.
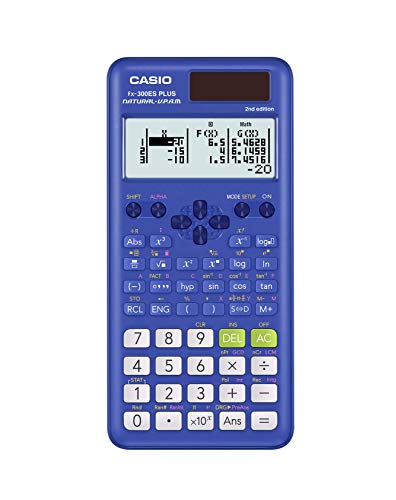
Casio fx-991ES Plus 2 Scientific Calculator with 417 Functions and Display, Natural
$32.30 View on Amazon
Free online Mean, Median, and Mode Calculator -- enter a data set to instantly compute all three measures of central tendency plus range and count. Includes explanations of when to use each measure.
Using Numbers (comma separated): 10, 20, 20, 30, 40, 50, 50, 50, 60:
The estimated Mean is 37.
| Result | Value |
|---|---|
| Mean | 37 |
| Median | 40 |
| Mode | 50 |
| Range | 50 |
| Standard Deviation | 16 |
| Variance | 267 |
| Count | 9 |
| Sum | 330 |
| Min | 10 |
| Max | 60 |
Adjust the values in the calculator above for your own scenario.
Preparing Mean Median Mode Calculator...
Every calculator is built using industry-standard formulas, validated against authoritative sources, and reviewed for accuracy against our published methodology. All calculations run privately in your browser - no data is stored or shared.
The mean, median, and mode are the three main ways to describe the center of a data set -- each answering a slightly different question. The mean tells you the arithmetic average. The median tells you the middle value after sorting. The mode tells you the most frequently occurring value. Choosing the right measure depends on your data's distribution and what you are trying to communicate. This calculator computes all three instantly, along with the range and count, so you can compare them side by side.
Mean = Sum of all values / Count of values Sort not required. Add everything up, divide by n. Example: (4 + 7 + 7 + 10 + 12) / 5 = 40 / 5 = 8.
Median = Middle value of a sorted list Sort the values in order. For an odd count, the median is the center value. For an even count, average the two center values. Example: sorted list {4, 7, 7, 10, 12} -- median is 7 (position 3 of 5). For {4, 7, 10, 12}: median = (7 + 10) / 2 = 8.5.
Mode = Value(s) appearing most often Count how many times each value appears. The mode is the value with the highest frequency. A data set can have one mode, two or more modes (bimodal/multimodal), or no mode if all values appear exactly once.
Range = Maximum value -- Minimum value. Measures total spread.
Example 1 -- Symmetric, well-behaved data set: {12, 14, 14, 16, 18, 20, 20, 20, 22} Mean: (12+14+14+16+18+20+20+20+22) / 9 = 156 / 9 = 17.33. Median: 9 values, center is position 5 = 18. Mode: 20 (appears 3 times). Range: 22 - 12 = 10. Mean and median are close (17.33 vs. 18), confirming near-symmetry.
Example 2 -- Outlier-skewed income data: {42000, 45000, 47000, 49000, 51000, 380000} Mean: 614,000 / 6 = $102,333. Median: average of positions 3 and 4 = (47,000 + 49,000) / 2 = $48,000. Mode: none (all unique). Range: $338,000. The mean of $102,333 is more than double the median of $48,000 -- the $380,000 outlier drags the mean far from where most values cluster. The median is the better "typical" value here.
Example 3 -- Retail shoe sizes: {7, 7, 8, 8, 8, 9, 9, 10, 11} Mean: 77 / 9 = 8.56. Median: position 5 = 8. Mode: 8 (appears 3 times). Range: 4. For a store manager deciding which size to stock most, the mode (8) is the most actionable number -- it tells you the single most common size, which neither the mean nor median directly indicates.
| Data Set | Mean | Median | Mode | Range | Best Measure |
|---|---|---|---|---|---|
| 2, 4, 4, 6, 8 | 4.80 | 4 | 4 | 6 | Any (symmetric) |
| 10, 20, 30, 40, 50 | 30 | 30 | None | 40 | Mean or median |
| 3, 3, 5, 5, 7, 9 | 5.33 | 5 | 3 and 5 | 6 | Median (bimodal) |
| 1, 1, 1, 100 | 25.75 | 1 | 1 | 99 | Median or mode |
| 40K, 45K, 50K, 55K, 500K | 138K | 50K | None | 460K | Median |
| Red, Blue, Blue, Green | N/A | N/A | Blue | N/A | Mode only |
| 15, 15, 16, 17, 17, 18 | 16.33 | 16.5 | 15 and 17 | 3 | Mean (symmetric) |
| 5, 6, 7, 8, 9, 10, 98 | 20.43 | 8 | None | 93 | Median |
These three measures appear throughout statistics, data analysis, journalism, and everyday decision-making. When the US Census Bureau reports household income, it publishes the median -- not the mean -- because the mean would be pulled upward by high-income households and misrepresent what a typical family earns. Sports analysts use batting averages (a mean) because the distribution of at-bat outcomes is relatively stable. Epidemiologists tracking disease incubation periods often report the median because the distribution is right-skewed. Understanding which measure to apply -- and why -- is one of the first and most practical skills in data literacy.
Copy this citation for papers, articles, or coursework:
Alex Crabinsky. "Mean Median Mode Calculator." Numeraty, February 24, 2026, https://numeraty.com/mean-median-mode-calculator/ Exam-approved Casio scientific calculators that handle the functions above.
As an Amazon Associate, we earn from qualifying purchases. Prices and availability are subject to change. Prices checked Sep 22, 2026.

Free online Age Calculator -- find your exact age in years, months, days, weeks, and total days from your date of birth. Includes next birthday countdown and milestone tracking.
Math & ScienceFree online Basic Calculator -- perform addition, subtraction, multiplication, division, exponents, and modulo operations. Instant results with up to 10 decimal places of precision.
Math & ScienceFree online Binary, Hexadecimal, and Decimal Converter -- convert between base-2, base-10, and base-16 number systems instantly. Essential for programming, computer science, and digital electronics.
Math & ScienceFree online Date Calculator -- find the exact number of days, weeks, months, and years between any two dates. Calculate date differences for project planning, contracts, age verification, and event countdowns.
Math & ScienceFree online Fraction Calculator -- add, subtract, multiply, and divide fractions with automatic simplification. Shows results as fractions and decimals. Supports mixed numbers and improper fractions.
Math & ScienceFree Fuel Consumption Converter -- convert between MPG (US), MPG (UK), L/100km, and km/L. Compare fuel economy ratings across US, UK, and metric systems for any vehicle.
Math & ScienceFree online GPA Calculator -- compute your grade point average from letter grades and credit hours. Supports weighted and unweighted GPA on a 4.0 scale with instant results.
Math & ScienceFree online Grade Calculator -- compute your weighted course grade from assignments, exams, and projects. Find out what score you need on your final exam to reach your target grade.
Math & ScienceFree online Logarithm Calculator -- compute common log (base 10), natural log (ln), and logarithms of any base. Includes log rules, formulas, and real-world applications.
Math & ScienceFree online Matrix Calculator -- perform matrix addition, subtraction, multiplication, transposition, and find determinants and inverses. Supports 2x2 and 3x3 matrices with step-by-step results.
Math & ScienceFree online Percentage Calculator -- find a percentage of a number, calculate percentage increase or decrease, compute percentage change, and determine percentage difference. Instant results with formulas and examples.
Math & ScienceFree online Probability Calculator -- compute single event probability, combined probability for independent and dependent events, and complementary probability. Includes formulas and practical examples.